

As human beings, it is our inherent nature to create structures to be able to survive and thrive. Over time, these structures start to form overlapping systems that function interdependently. Understanding how these structures & patterns render themselves can be simplified through the use of systems thinking.
Peter Senge defines systems thinking as a disciple for seeing wholes. It is a framework for seeing interrelationships, rather than things, for seeing ‘patterns of change’ rather than static snapshots. Service design, on the other hand, is a process in which a designer focuses on creating optimal service experiences. This requires taking a comprehensive view of all the related actors, their interactions, and supporting materials and infrastructures. Going by the scale and complexity of most services in today’s times, it is can be eye-opening to examine them from a systems thinking lens.
We started by reading up on systems thinking and understanding existing tools used in service design and design thinking. Following this, we scanned online journals and news websites to get a pulse of the ripples created by Airbnb across the world.
With all the research under our belt we began forming different clusters of information about hosts and guests; their emotional and physical interactions and transactions; the trends and factors affecting their behaviours; socio-economic gains and disadvantages; competition and market in the hospitality sector; security and community issues. Based on these clusters and news articles on airbnb, we outlined some stories to give a face to the different relationships.
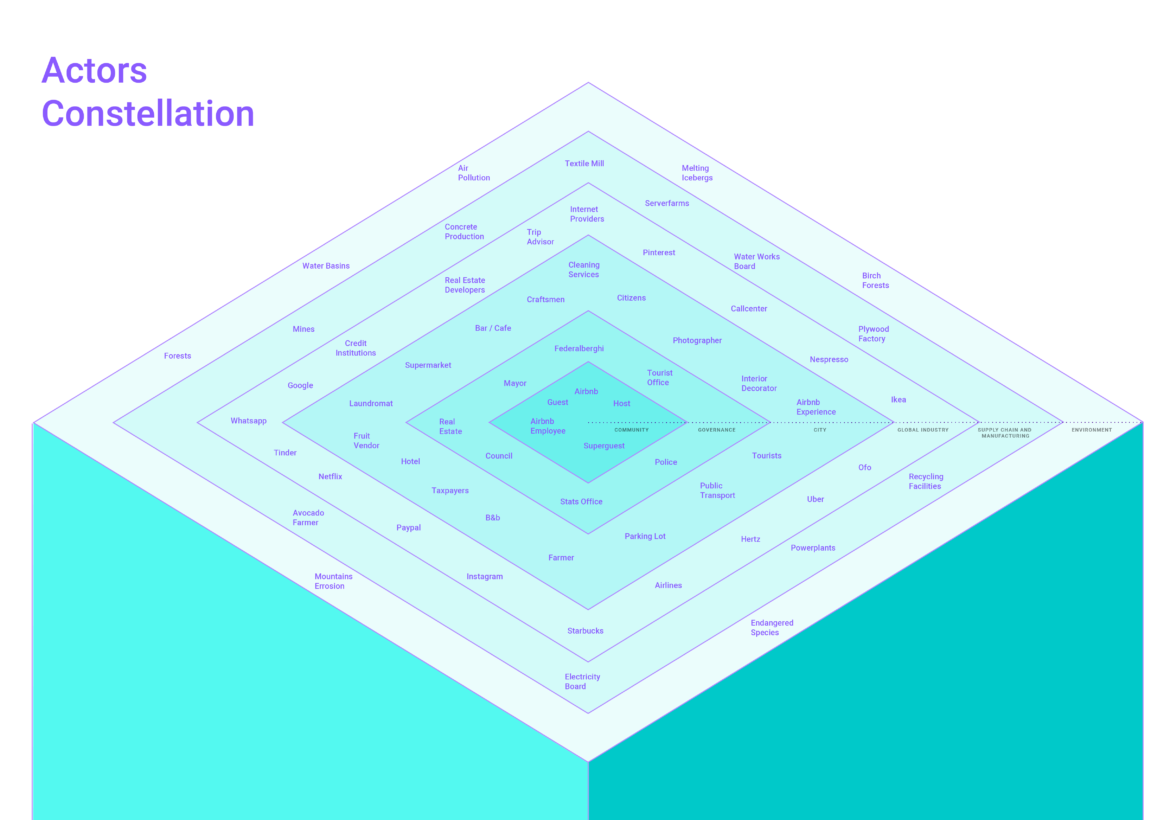
Simultaneously, we also identified some obvious and some seemingly unrelated actors from each story. These were then visually mapped and classified into different ‘layers’ based on Bratton’s theory of ‘Stack’. Stack is about the differentiation of systems into six levels of analysis that allows greater specialization in each and a holistic understanding of the relation of the parts to the whole.
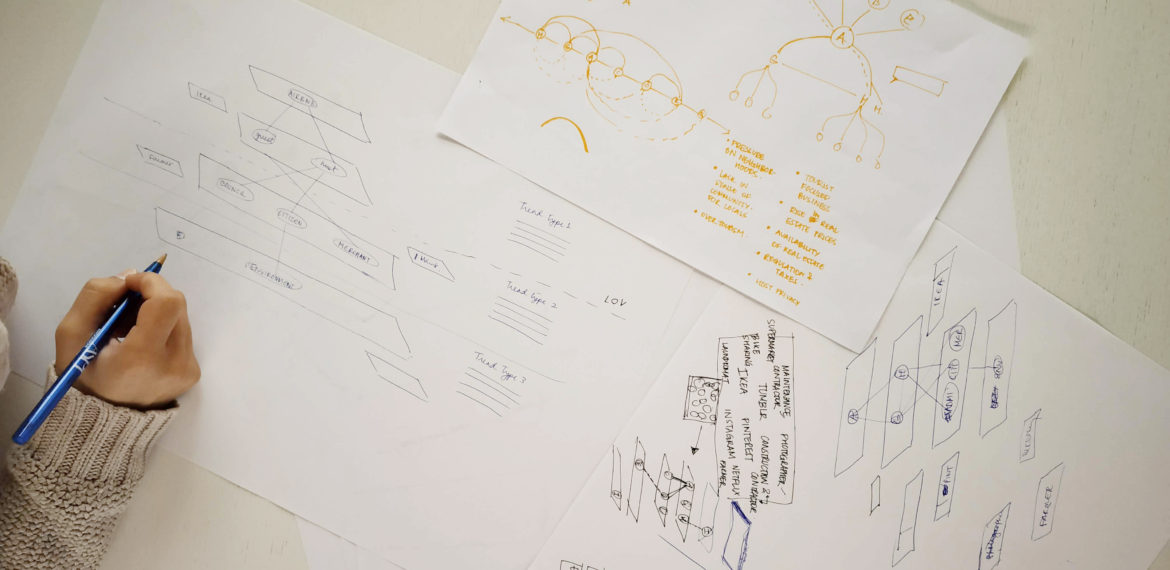
We played around with the stories and fused some of them to sketch out the larger system, depicting it through various loops and graphical representations. We tried circular interactions, connections in stacks as well as layers.
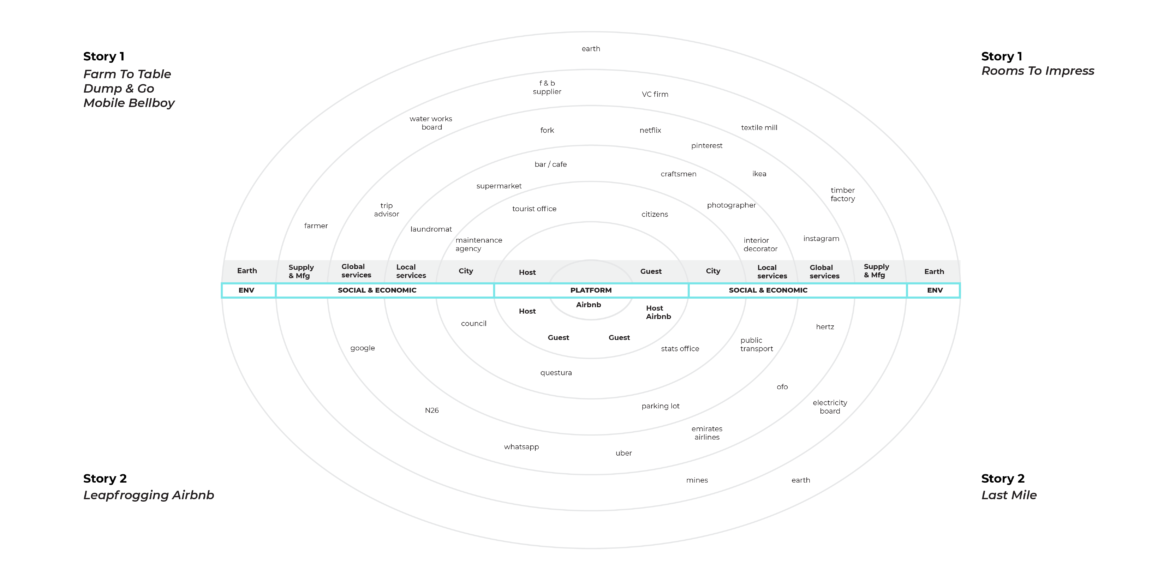
We started representing the actors we had identified earlier, in the form of a constellation with different orbits for different layers of the system.
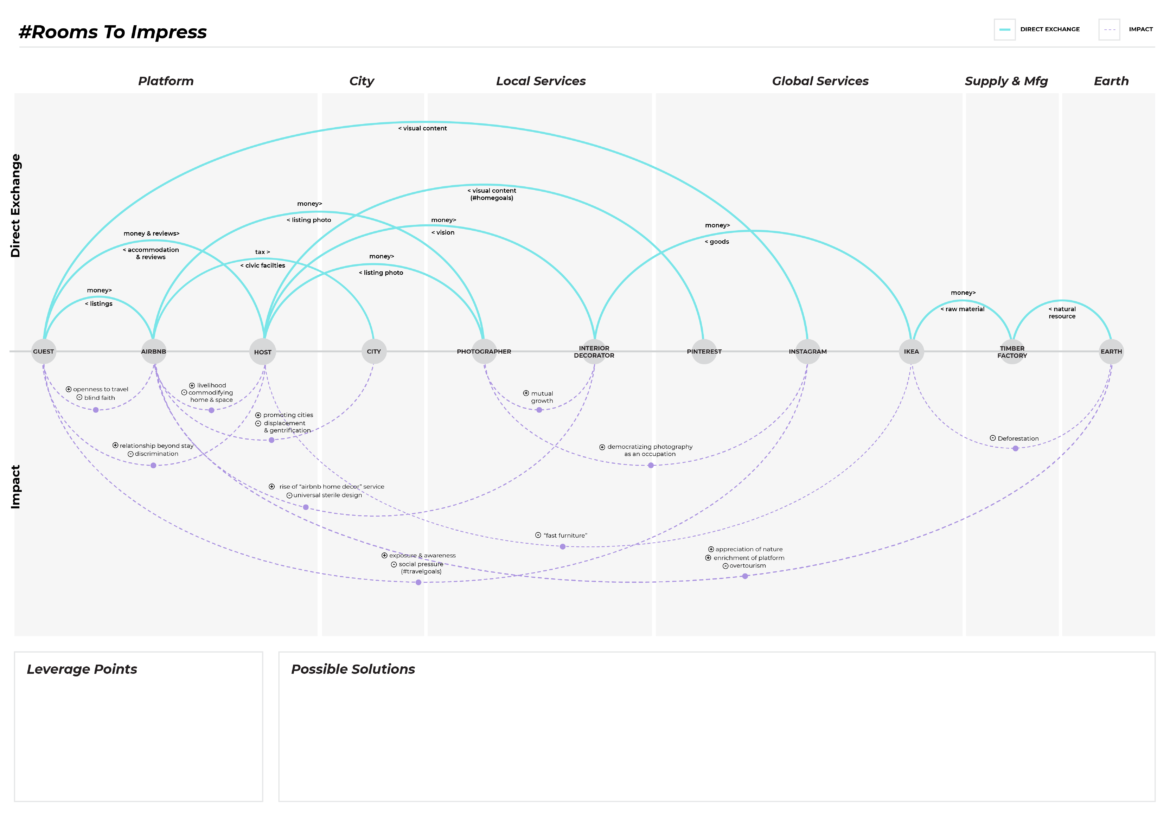
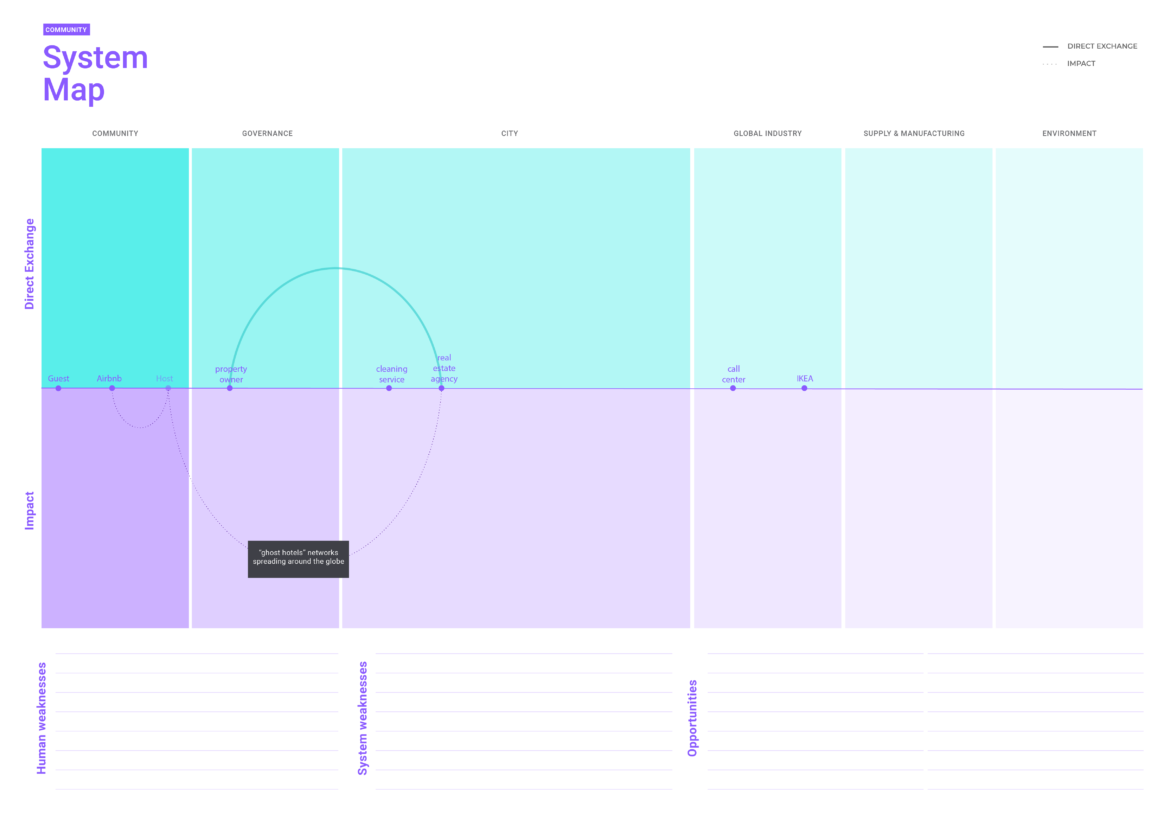
We got clarity with the system map by showing two types of information- visible exchanges and and invisible impacts by separating them with the line of visibility.
After several iterations, we finally created three deliverables for the workshop- a set of prompter statement cards, an actors constellation and a system map.
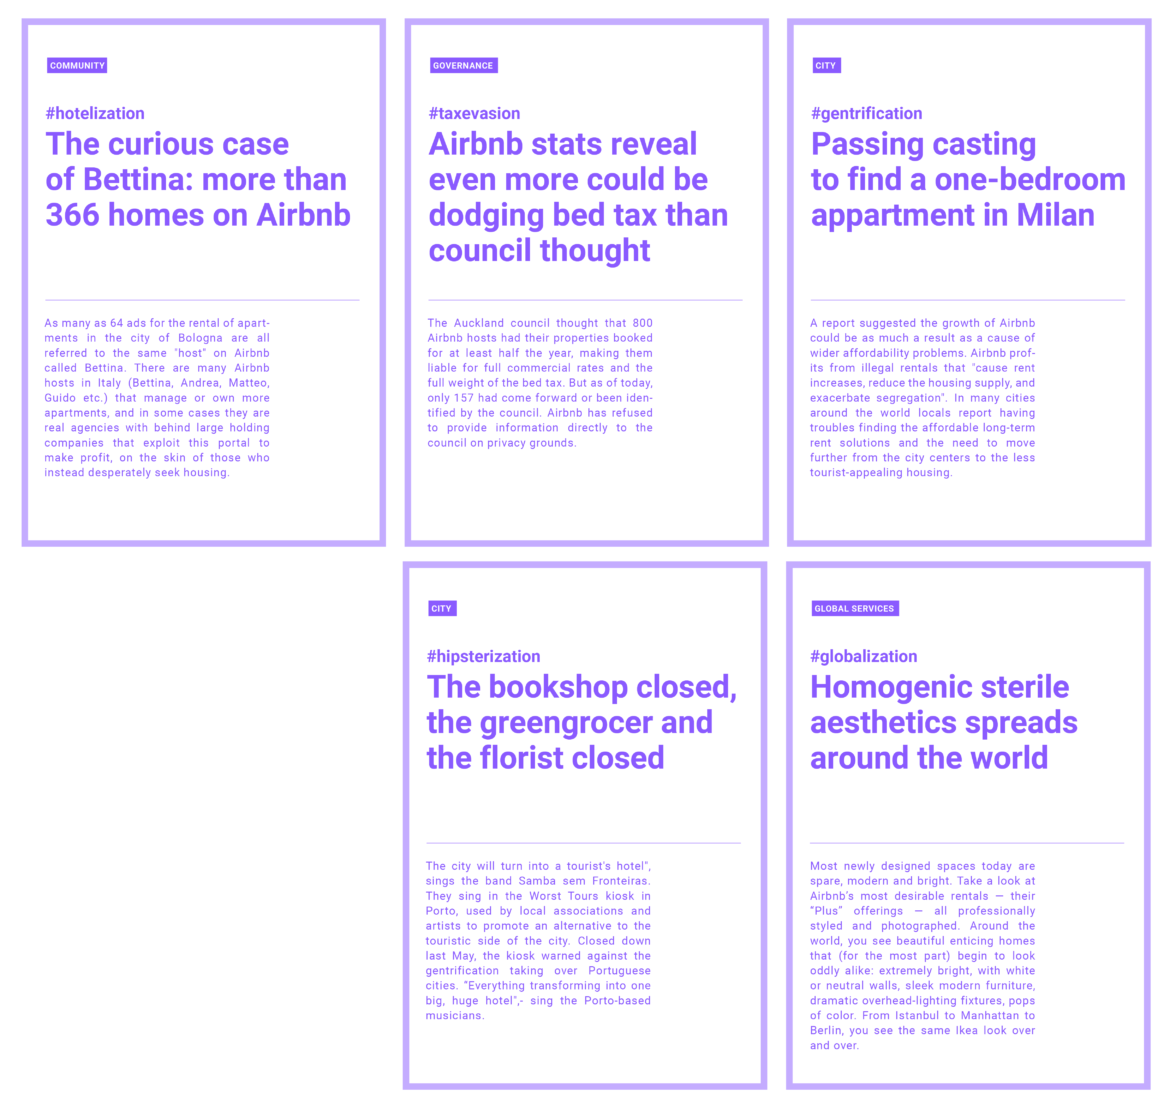
1. The prompter statements were make-believe quotations formulated from actual cases that we researched. These statements were designed to give the participants a nudge into seeing different scenarios related to airbnbfication.
2. The actors constellation positioned the actors in different layers of the system— platform, community, governance, city, global industry, supply chain & manufacturing and environment. These layers were defined based on the theme of urban intelligence. The intention was to help the participants see non-obvious connections across the layers and add more actors based on the prompter statements.
3. Lastly, a semi-filled system map was created for the participants to place actors across the different layers of the system while depicting some visible interactions and their invisible impacts as loops. The aim was to help visually assess & analyse a system in all its parts and drive the thought process in an opportunity defining space. Each story was pre-mapped by us for our own preparation for the workshop.
The workshop began with an interactive presentation on systems thinking by team Oblo. We then divided the participants in 5 groups of 4 each. The teams were handed over the material for the workshop- one prompter statement card, an actors constellation & a system map. We facilitated the teams to analyze the scenario based on the statements, explore the actors constellation and enrich the system map with actors, interactions, impacts and opportunities. In the end, each team discussed their system map and their understanding of urban services through systems thinking.
Through this journey of creating the workshop, we learnt to look at systems with bird’s eye view while at the same time, zoom into individual components of the super-system. While we began by looking for pre-existing tools, in the end, we designed our own tools that suited the workshop needs better. It took us these intense maps to see that the implications of what we design as strategic-service designers is highly exponential !